

FINANCIAL PROFESSIONALS ONLY
U.S. Small-Cap Market Overview
September 30, 2026


Table of Contents
5Year-to-Date Small-Cap Overview as of 9/30/26
63Q26 Sector and Industry Review
7Year-to-Date Sector and Industry Review
8Despite Recent Outperformance, Small-Caps Remain Near Low Versus Large-Caps
9Small-Cap Remains Cheaper than Large-Cap Size Segments
11Historically Small-Cap Cycles Have Averaged More Than a Decade
12Small-Cap’s Weight in the Russell 3000 Remains Below Historical Low
13Large-Cap Cycles Peak at Market Tops Crowded with Mega-Caps
14Relative Valuations for Small-Caps vs. Large-Caps are Still Below Average
16No Reason to Panic After a Rate Hike
17Small-Cap Earnings Growth—Secular Tailwinds
18Small-Cap’s Estimated Earnings Growth is Expected to Be Higher Than Large-Cap’s in 2026 and 2027
19Strong Earnings Growth in the Russell 2000 Was Offset by Multiple Contraction in 3Q26
20Low-Quality Has Underperformed Over the Long Run
21The Most Alpha Generation Potential Remains in Small-Cap
22Active Small-Cap Has Historically Outperformed in Broadening Markets
23Large Intra-Year Declines Are Frequent
U.S. Small Cap Market Overview Royce Investment Partners
PAGE 2

Market Overview
Following a powerful second-quarter rally, small- and micro-cap stocks retreated in the third quarter of 2026 as large- and mega-cap stocks outperformed. Geopolitical tensions, persistent inflation, elevated energy prices, and shifting interest rate expectations influenced sentiment, while continued investment in artificial intelligence infrastructure supported larger technology-oriented companies.
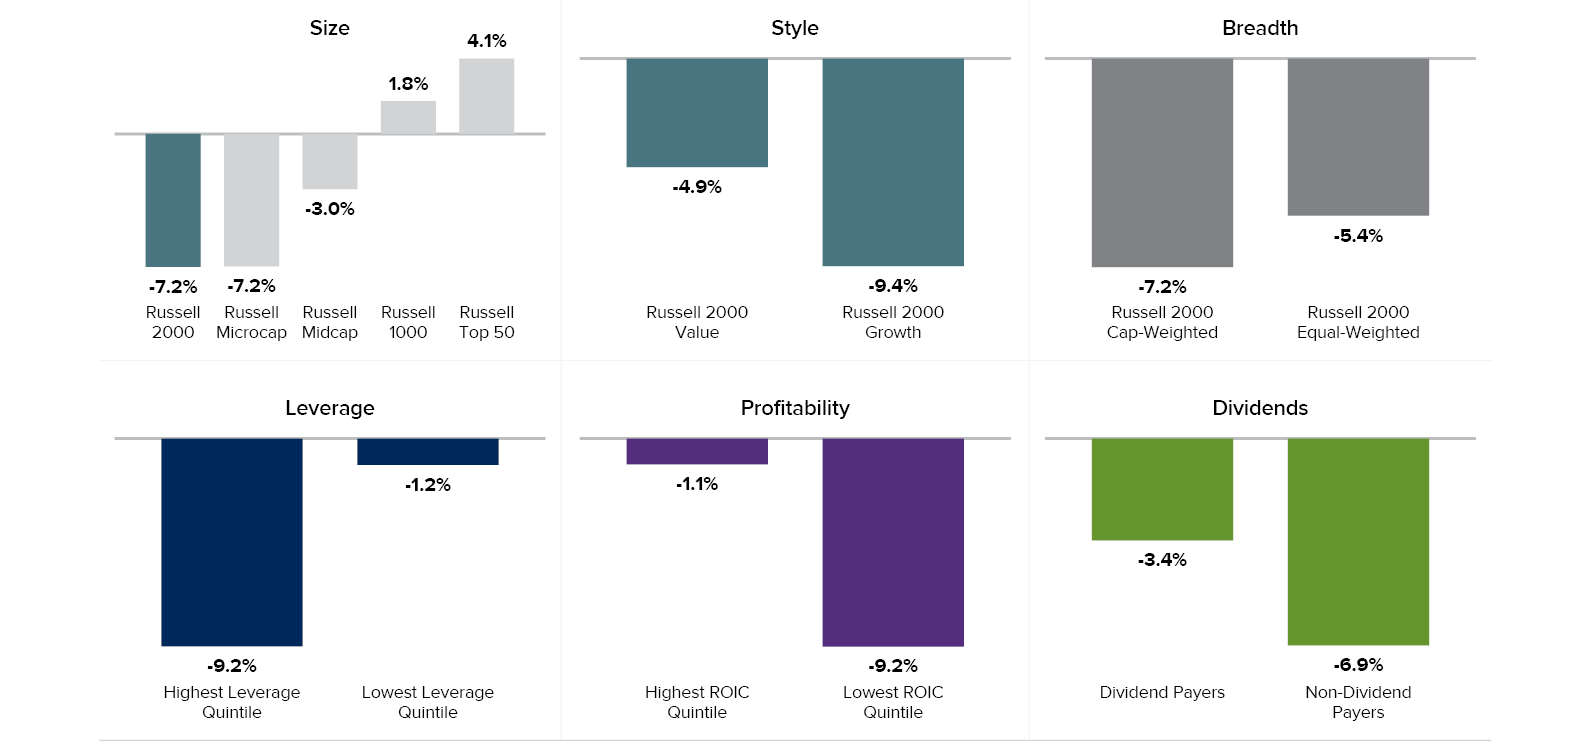
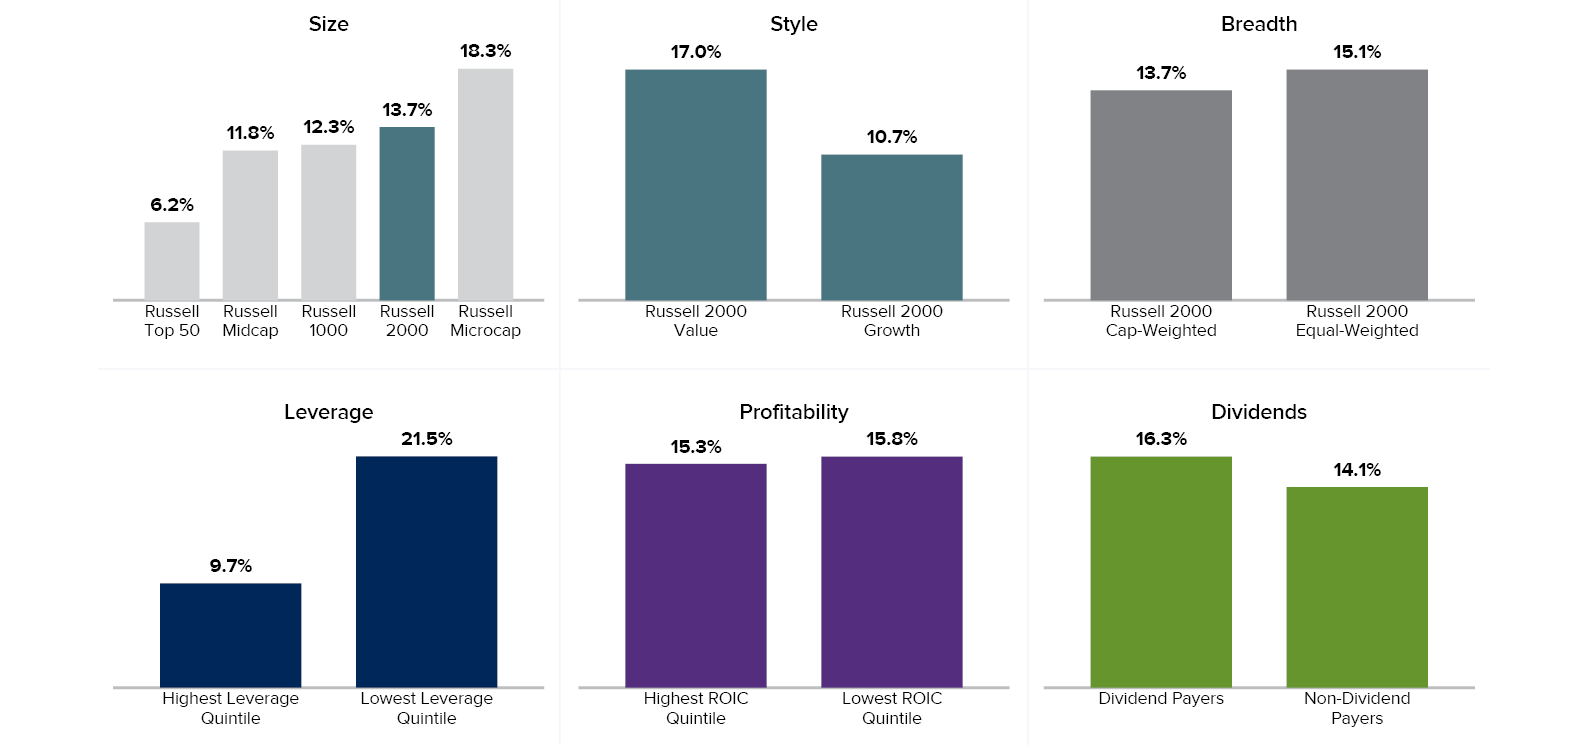
For the quarter ended September 30, 2026, the Russell 2000 and Russell Microcap Indexes each declined -7.2%, versus gains of 1.8% for the Russell 1000 and 4.1% for the Russell Top 50. Despite this reversal, smaller stocks maintained their year-to-date leadership. The Russell 2000 advanced 13.7% and the Russell Microcap gained 18.3%, compared with respective increases of 12.3% and 6.2% for the Russell 1000 and Russell Top 50.
Longer-term performance also reinforces our constructive outlook. From the April 8, 2025 market low through September 30, 2026, the Russell 2000 gained 61.9% and the Russell Microcap advanced 93.4%, outpacing the Russell 1000’s 55.5% return. We believe attractive relative valuations, improving earnings prospects, and broader market participation could support continued small-cap leadership, particularly if economic growth remains intact.
Despite ongoing risks related to earnings execution, funding conditions, and macroeconomic uncertainty, we remain optimistic about small-caps’ longer-term prospects. With elevated dispersion creating opportunities for active investors, we favor fundamentally strong businesses with healthy balance sheets, sustainable margins, consistent profitability, and disciplined management teams.

3Q26 Small-Cap Overview
Small-cap leadership reversed in the third quarter of 2026 as larger stocks outperformed. Within the Russell 2000, value outperformed growth, while the equal-weighted index fared better than the capitalization-weighted index. Lower-leverage, higher-profitability, and dividend-paying stocks also demonstrated greater resilience, underscoring the importance of financial strength and disciplined stock selection during periods of market volatility.
U.S. Small Cap Market Overview Royce Investment Partners
PAGE 4

Year-to-Date Small-Cap Overview as of 9/30/26
Small- and micro-cap stocks maintained year-to-date leadership through September 30, 2026, despite third-quarter weakness. Within the Russell 2000, value outperformed growth, while the equal-weighted index fared better than the capitalization-weighted index. Lower-leverage and dividend-paying companies also outperformed, while profitability had limited impact, with the highest- and lowest-ROIC quintiles posting similar returns. These results highlight the breadth of small-cap strength and the relative resilience of companies with lower leverage.
U.S. Small Cap Market Overview Royce Investment Partners
PAGE 5
3Q26 Sector and Industry Review
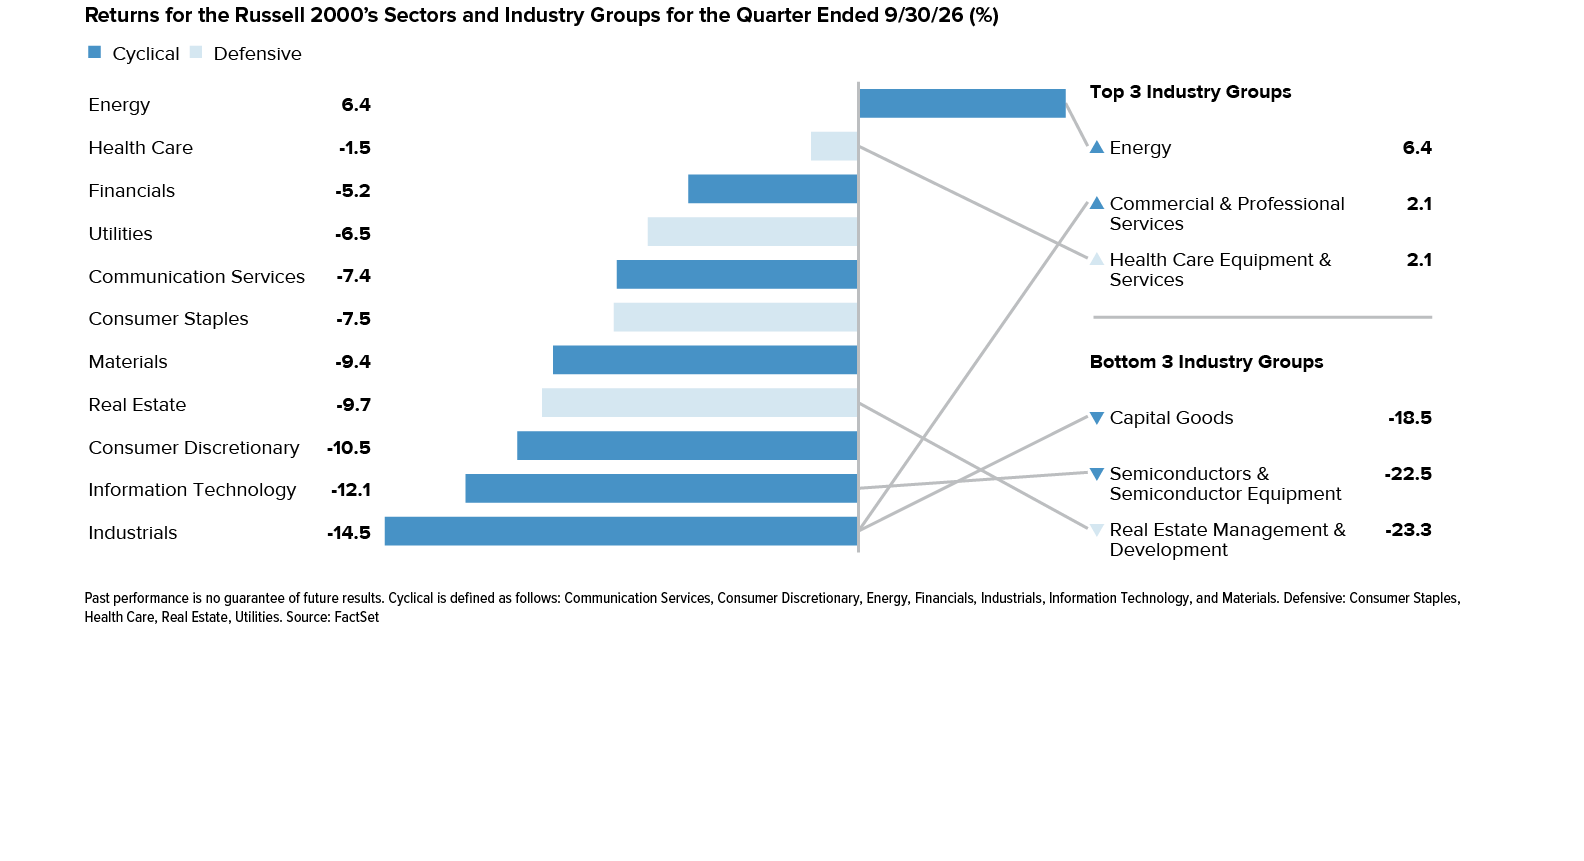
Third-quarter performance was broadly negative across Russell 2000 sectors, with Energy the lone gainer, advancing 6.4%. Industrials (-14.5%) and Information Technology (-12.1%) experienced sharp declines, while semiconductors & semiconductor equipment fell -22.5%. Despite these losses, several of the quarter’s weakest performers remained among the strongest year to date, illustrating how quickly small-cap market leadership can shift and reinforcing the importance of disciplined stock selection.
U.S. Small Cap Market Overview Royce Investment Partners
PAGE 6
Year-to-Date Sector and Industry Review
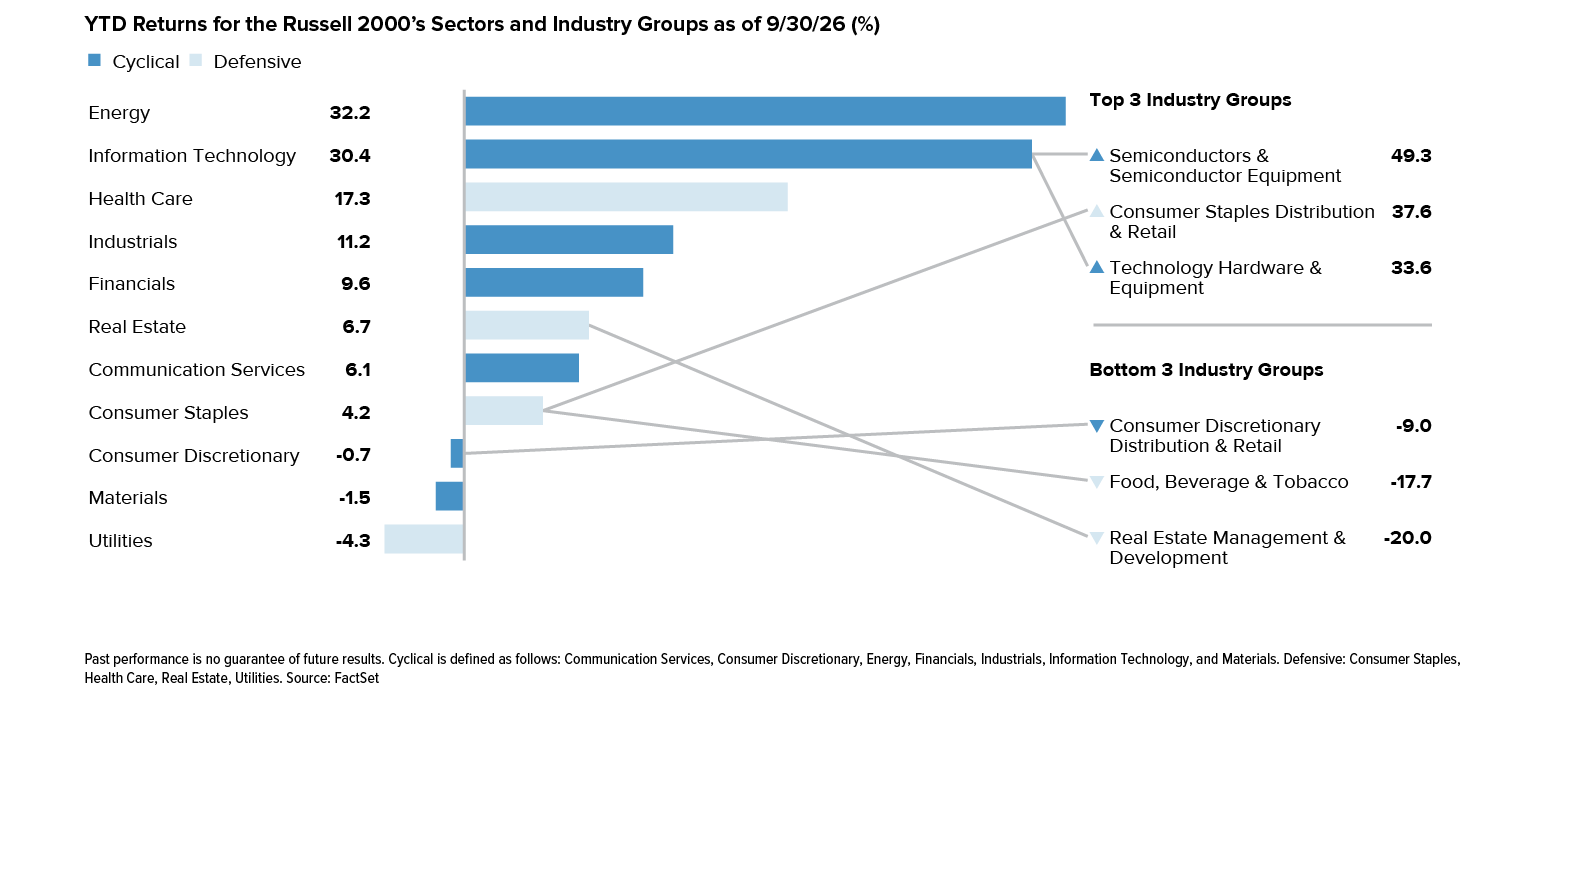
Year-to-date performance highlights the considerable dispersion within small-caps and the contrast with third-quarter results. Energy led Russell 2000 sectors with a 32.2% gain (and was also the only sector to advance during the third quarter). Information Technology gained up 30.4% despite third-quarter weakness, while semiconductors & semiconductor equipment gained 49.3% year to date even after declining -22.5% during the quarter. Health Care and Industrials also posted double-digit gains, while three sectors finished in negative territory. These divergent results underscore the importance of sector positioning, valuation discipline, and fundamental research in navigating changing market conditions.
U.S. Small Cap Market Overview Royce Investment Partners
PAGE 7
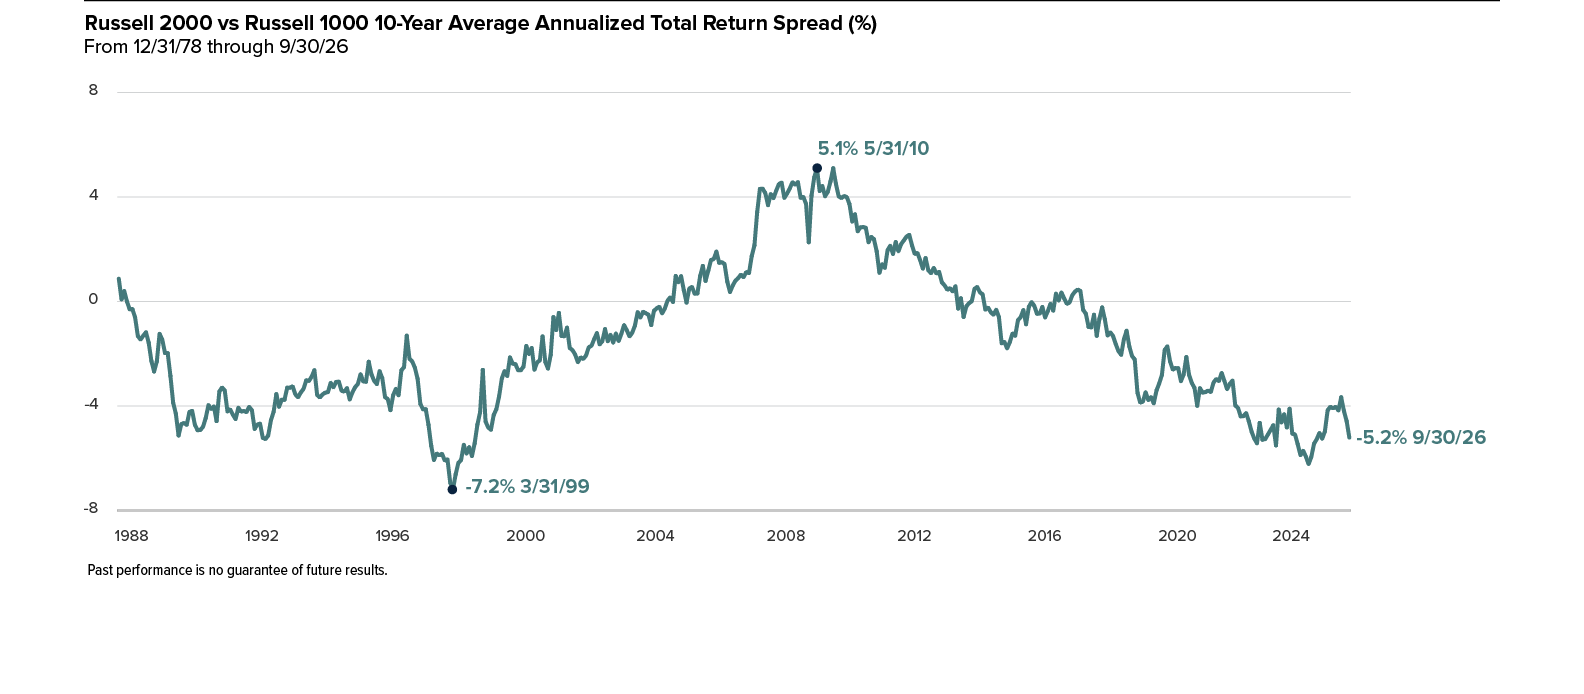
Despite Recent Outperformance, Small-Caps Remain Near Low Versus Large-Caps
U.S. Small Cap Market Overview Royce Investment Partners
PAGE 8
Small-Cap Remains Cheaper than Large-Cap Size Segments
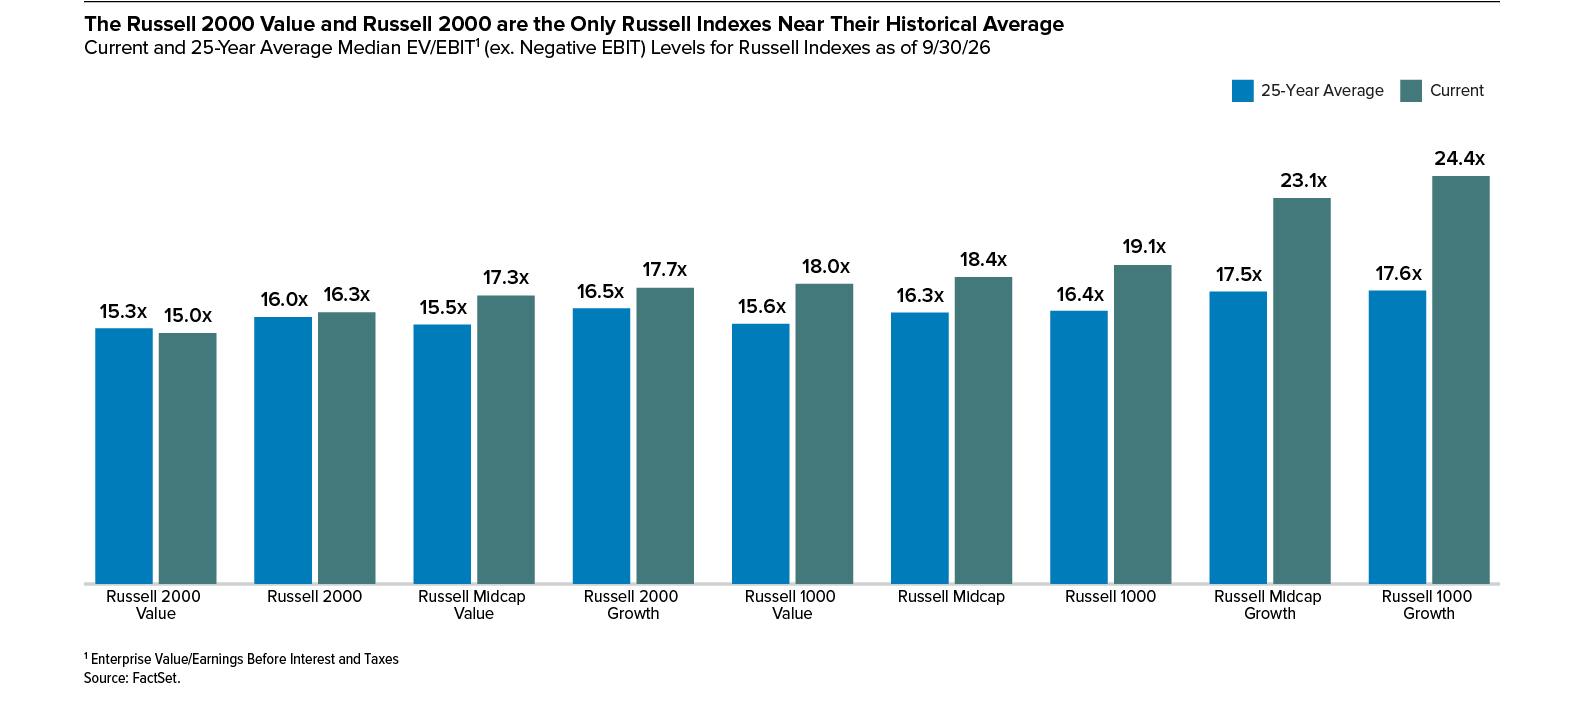
Small-cap stocks continued to trade at more attractive valuations than their larger-cap counterparts as of September 30, 2026, based on median enterprise value to earnings before interest and taxes (EV/EBIT). Four observations stand out: 1) Small-Cap Value and the broader Small-Cap segment remained among the least expensive areas of the U.S. equity market, trading at 15.0x and 16.3x, respectively; 2) Small-Cap Value was the only segment trading below its 25-year average valuation, while the Russell 2000 remained only modestly above its historical average; 3) Mid-Cap Value and Large-Cap Value traded at similar valuations of 17.3x and 18.0x, respectively, despite differing historical averages; and 4) Growth stocks, particularly Large-Cap Growth at 24.4x and Mid-Cap Growth at 23.1x, continued to command substantial premiums to their historical averages. These valuation differences reinforce our view that small-cap stocks, particularly value-oriented companies, offer a potentially attractive opportunity for disciplined, long-term investors.
U.S. Small Cap Market Overview Royce Investment Partners
PAGE 9

Historical Perspective
Elevated U.S. equity valuations remained a concern through the third quarter of 2026, particularly among the Magnificent Seven and in large-cap benchmarks such as the Nasdaq 100 and S&P 500. In contrast, we believe small-caps continued to offer more attractive relative valuations.
Two long-term measures illustrate this gap. Historically, the Russell 2000 has accounted for approximately 7.6% of the Russell 3000’s total market capitalization, compared with just 4.0% as of September 30, 2026. As of September 30, 2026, the Russell 2000 traded at a median enterprise value to earnings before interest and taxes (EV/EBIT) multiple of 16.3x versus 19.1x for the Russell 1000. Small-cap value stocks were particularly attractive at 15.0x, below their 25-year historical average of 15.3x.
We believe the long-term case for small-caps remains compelling, supported by attractive relative valuations, improving earnings growth potential, and potentially lower borrowing costs. We continue to favor high-quality small-cap businesses with durable fundamentals, strong balance sheets, and disciplined capital allocation.
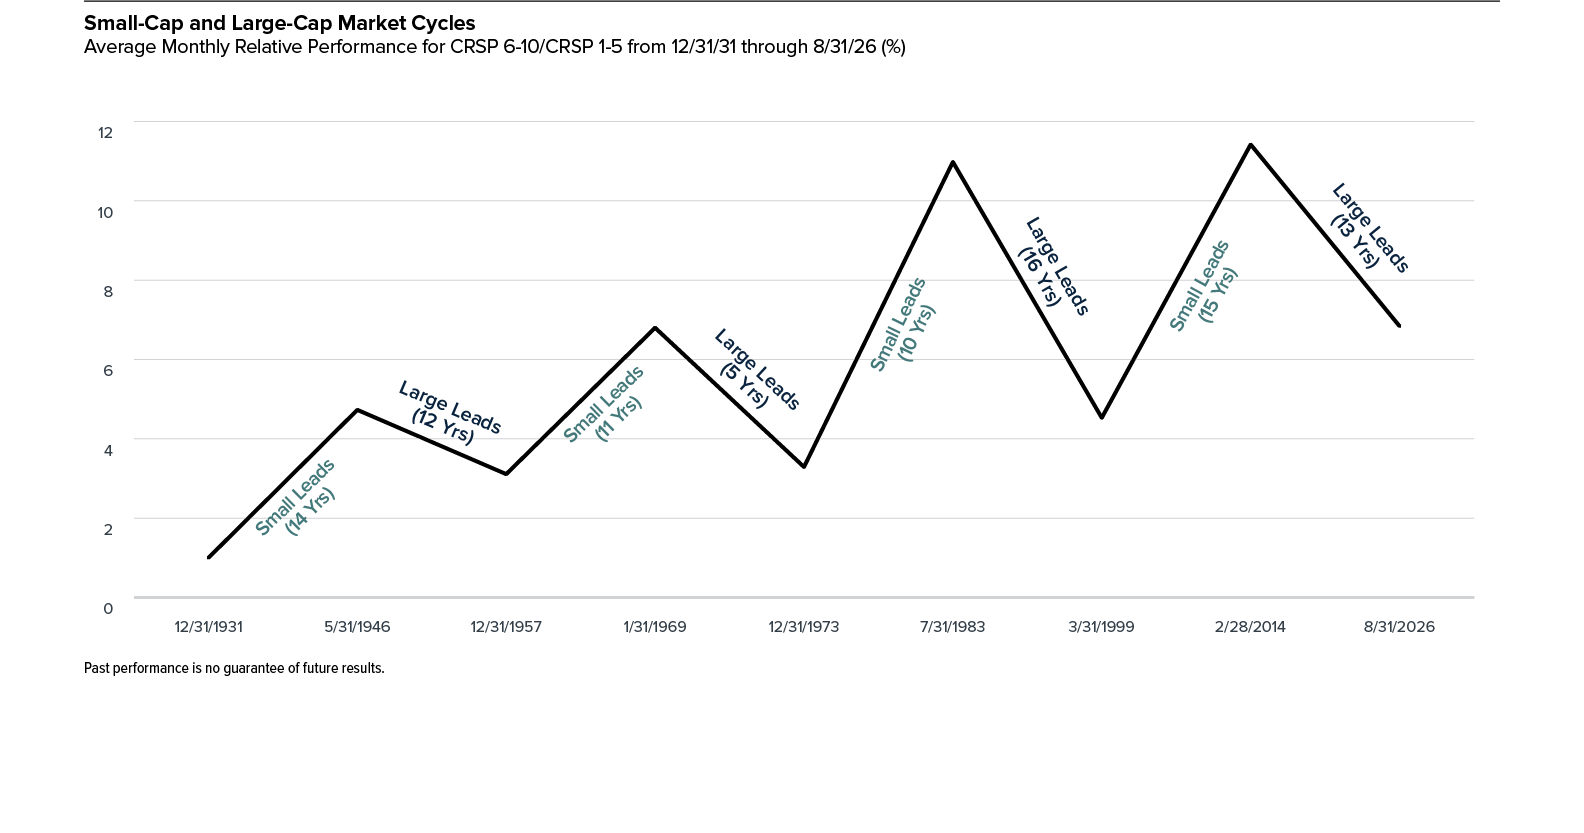
Historically Small-Cap Cycles Have Averaged More Than a Decade
Secular changes in economic trends, interest rates, and monetary and fiscal policies continue to alter the long-term investment landscape. The winners under the past decade’s zero interest rate, low inflation, and low nominal growth regime may be less likely to maintain their historical leadership in a period with higher inflation and rising rates. The unfolding macro environment suggests that small-caps could sustain a period of relative outperformance rather than merely outperform tactically.
U.S. Small Cap Market Overview Royce Investment Partners
PAGE 11
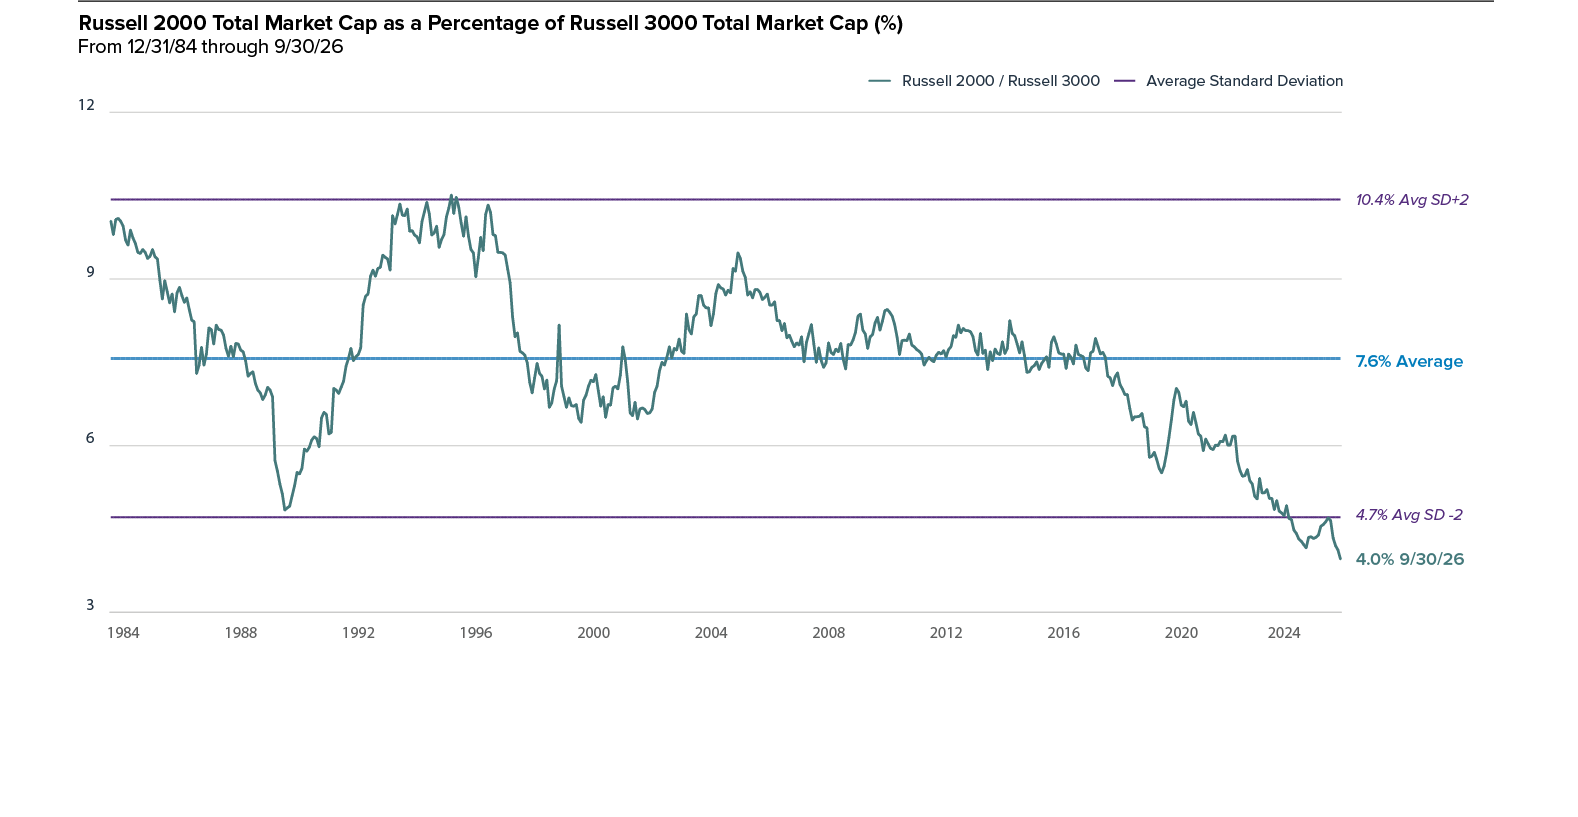
Small-Cap’s Weight in the Russell 3000 Remains Below Historical Low
Small-cap’s long-term underperformance versus large-cap has reached such an extreme point that small-cap’s weight in the Russell 3000 sits at historical lows not seen since the early 1990s, another indicator suggesting that a sustained small-cap rebound may be here.

U.S. Small Cap Market Overview Royce Investment Partners
PAGE 12
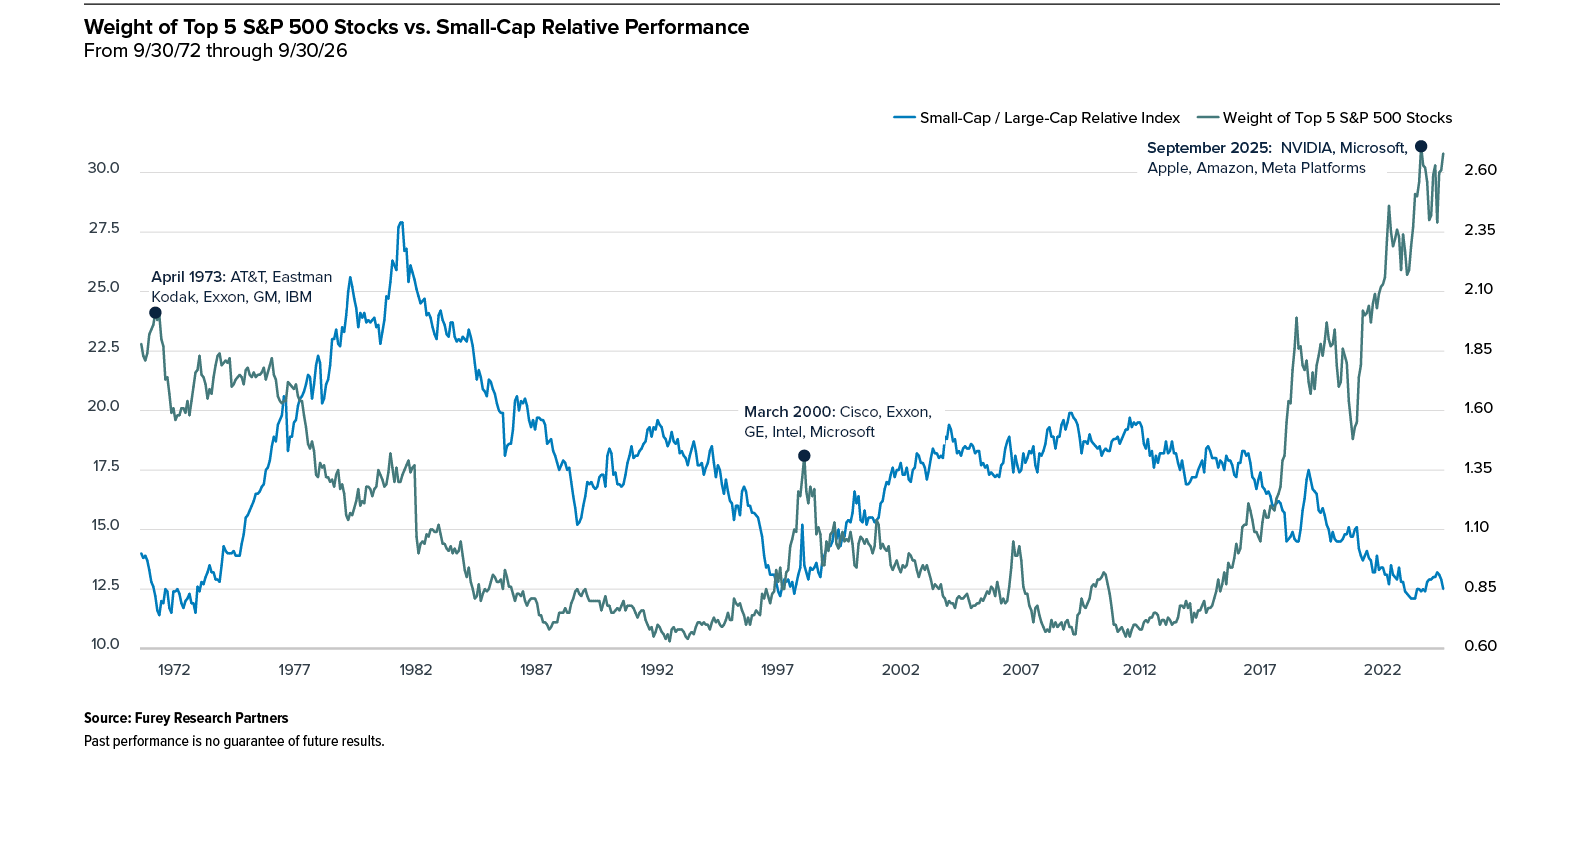
Large-Cap Cycles Peak at Market Tops Crowded with Mega-Caps
U.S. Small Cap Market Overview Royce Investment Partners
PAGE 13
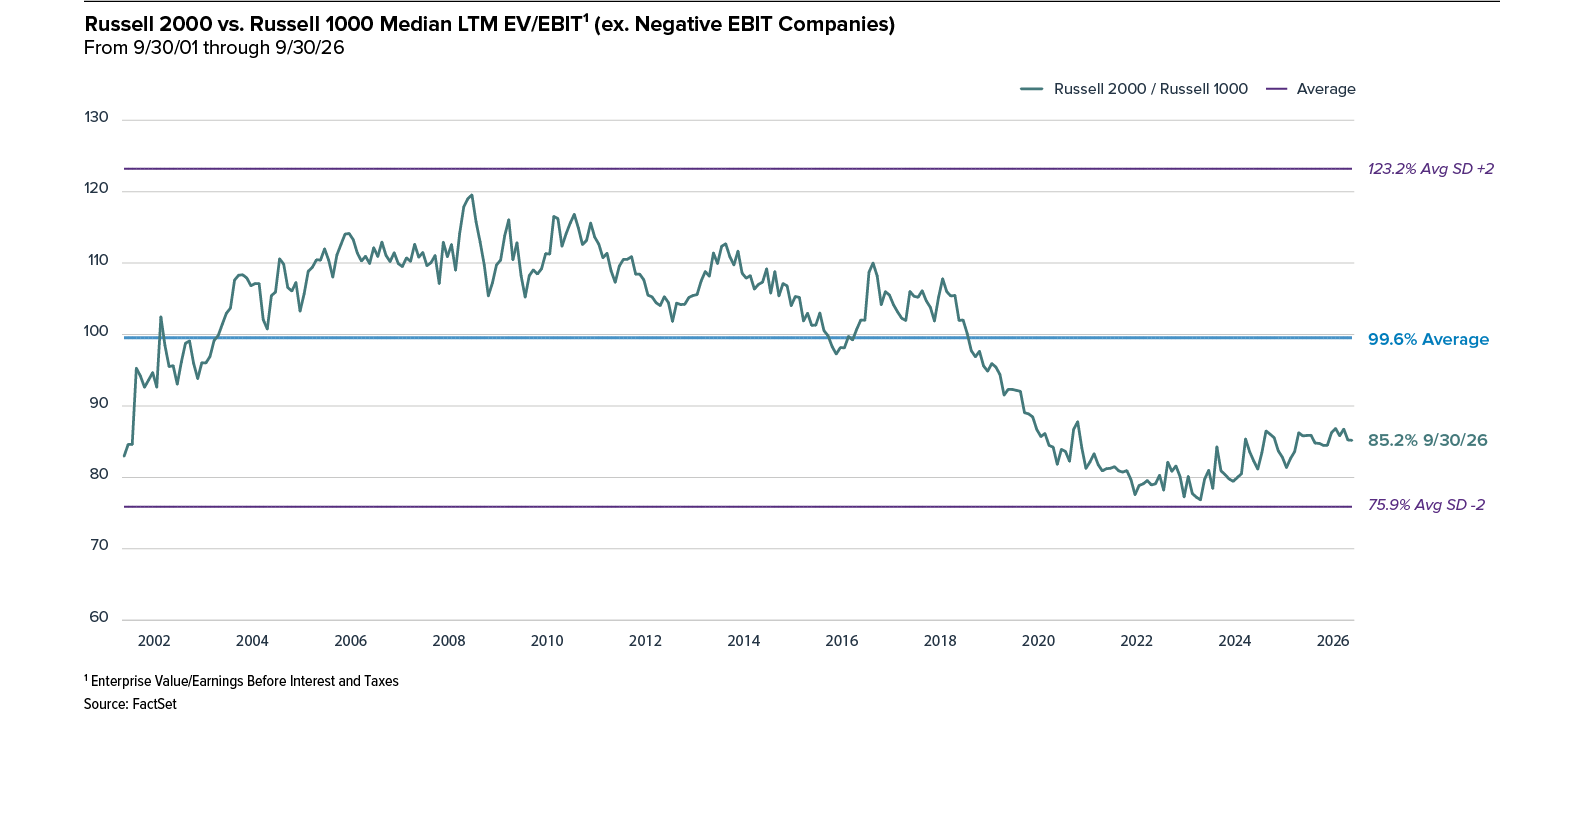
Relative Valuations for Small-Caps vs. Large-Caps are Still Below Average
Even with recent outperformance, the Russell 2000 continues to trade at a substantial relative valuation discount to the Russell 1000 compared with its 25-year average.
U.S. Small Cap Market Overview Royce Investment Partners
PAGE 14

Small-Cap Market Outlook
We remain constructive on the long-term outlook for U.S. small-cap equities, despite the third-quarter pullback and ongoing economic uncertainty. While trade policies, inflation, interest rates, and geopolitical tensions continue to influence sentiment, we believe small-cap fundamentals remain encouraging. Improving earnings prospects, attractive relative valuations, and secular trends including reshoring, infrastructure investment, and U.S. manufacturing modernization support our positive outlook.
As of September 30, 2026, small-cap stocks remained meaningfully less expensive than large-caps. Based on enterprise value to earnings before interest and taxes (EV/EBIT), our preferred valuation measure, the Russell 2000 traded at 16.3x versus 19.1x for the Russell 1000. Small-cap value stocks appeared particularly attractive at 15.0x, below their 25-year historical average of 15.3x. Despite the recovery from April 2025 low, these valuation disparities continue to present long-term investment opportunities.
Stronger earnings growth potential also remains central to the small-cap investment case. Despite renewed third-quarter volatility, positive year-to-date performance reflects progress following years of relative underperformance. We believe attractive valuations, improving earnings prospects, and disciplined capital allocation create opportunities for active managers to identify high-quality businesses with strong balance sheets, durable competitive advantages, and long-term value creation potential.
No Reason to Panic After a Rate Hike
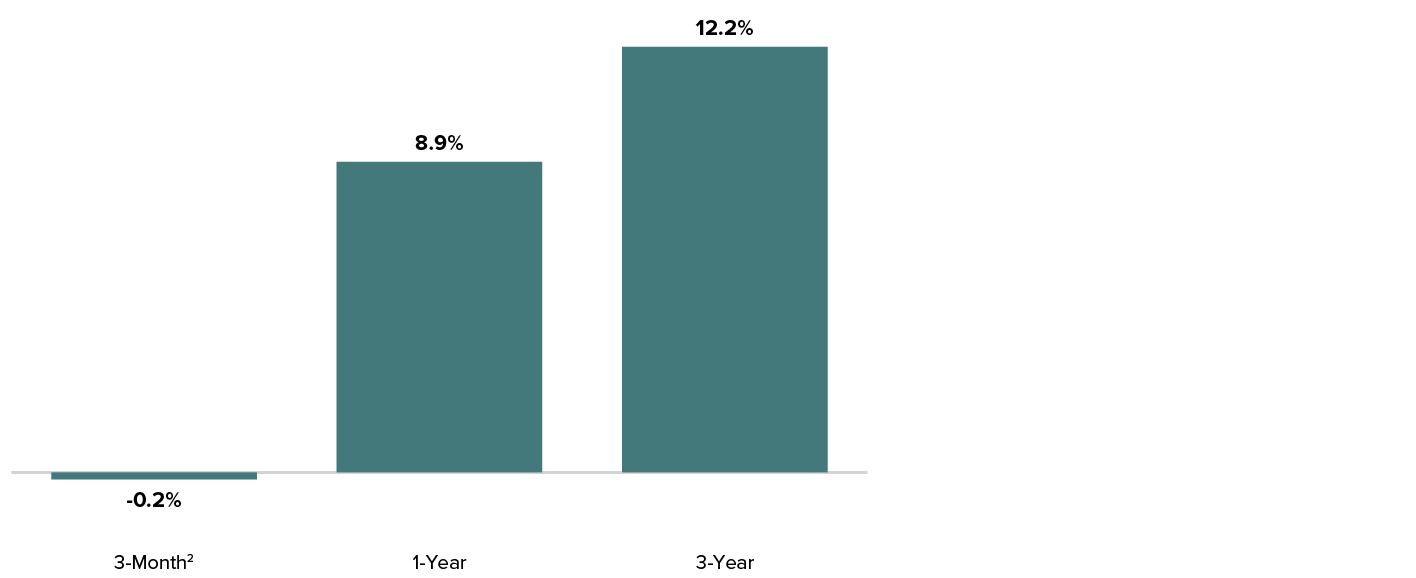
History suggests that an initial Federal Reserve rate hike has not necessarily been a headwind for small-cap stocks. From March 1972 through September 2026, the Morningstar U.S. Small Blend Category averaged a modest -0.2% return in the three months following initial rate hikes, but returns improved to 8.9% over one year and 12.2% annualized over three years. These results reinforce the importance of maintaining a long-term perspective rather than reacting to short-term interest rate uncertainty.


U.S. Small Cap Market Overview Royce Investment Partners
PAGE 16
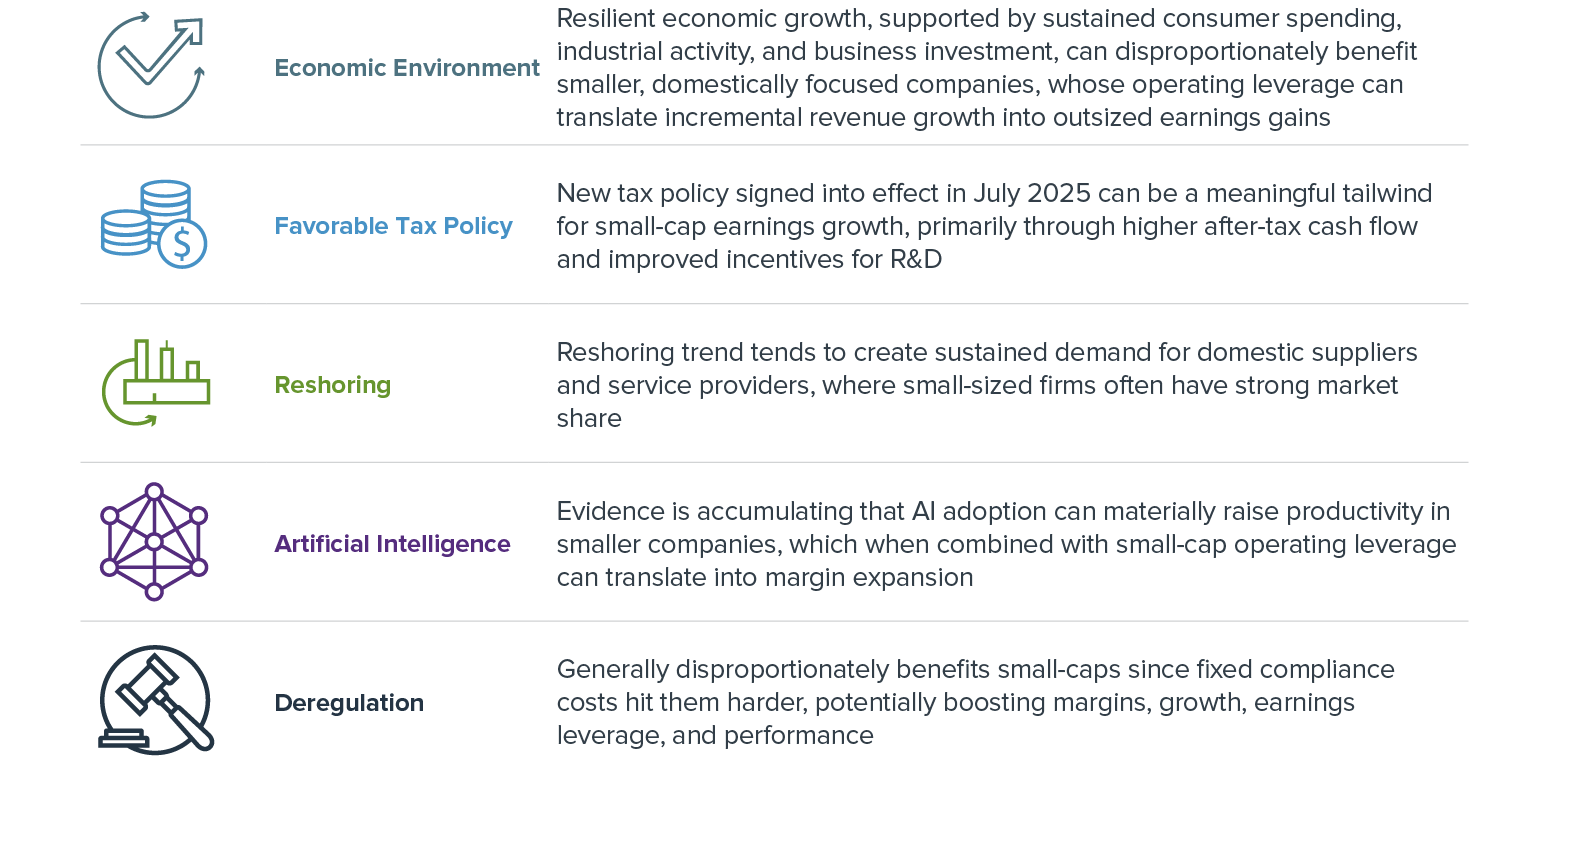
Small-Cap Earnings Growth—Secular Tailwinds
Small-cap earnings prospects appear to be improving as companies emerge from a multiyear downturn and benefit from a lower earnings base. Historically, earnings recoveries have supported small-cap performance. Greater domestic exposure and operating leverage could amplify the benefits of stronger demand, easing cost pressures, improved access to capital, and favorable secular trends.
U.S. Small Cap Market Overview Royce Investment Partners
PAGE 17
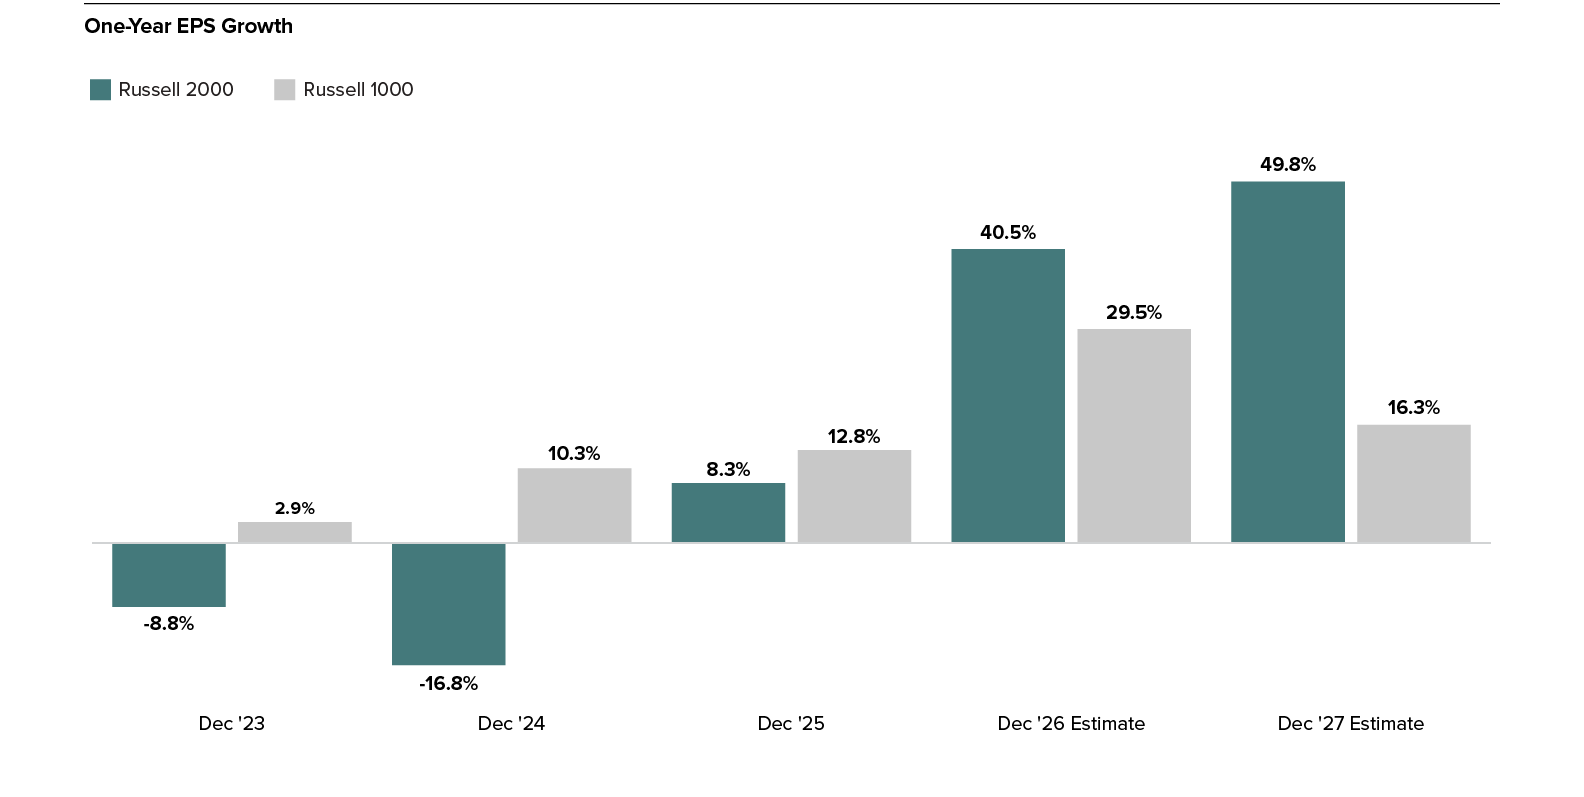
Small-Cap’s Estimated Earnings Growth is Expected to Be Higher Than Large-Cap’s in 2026 and 2027
Consensus estimates point to substantially faster EPS growth for the Russell 2000 than for the Russell 1000 in 2026 and 2027.

U.S. Small Cap Market Overview Royce Investment Partners
PAGE 18
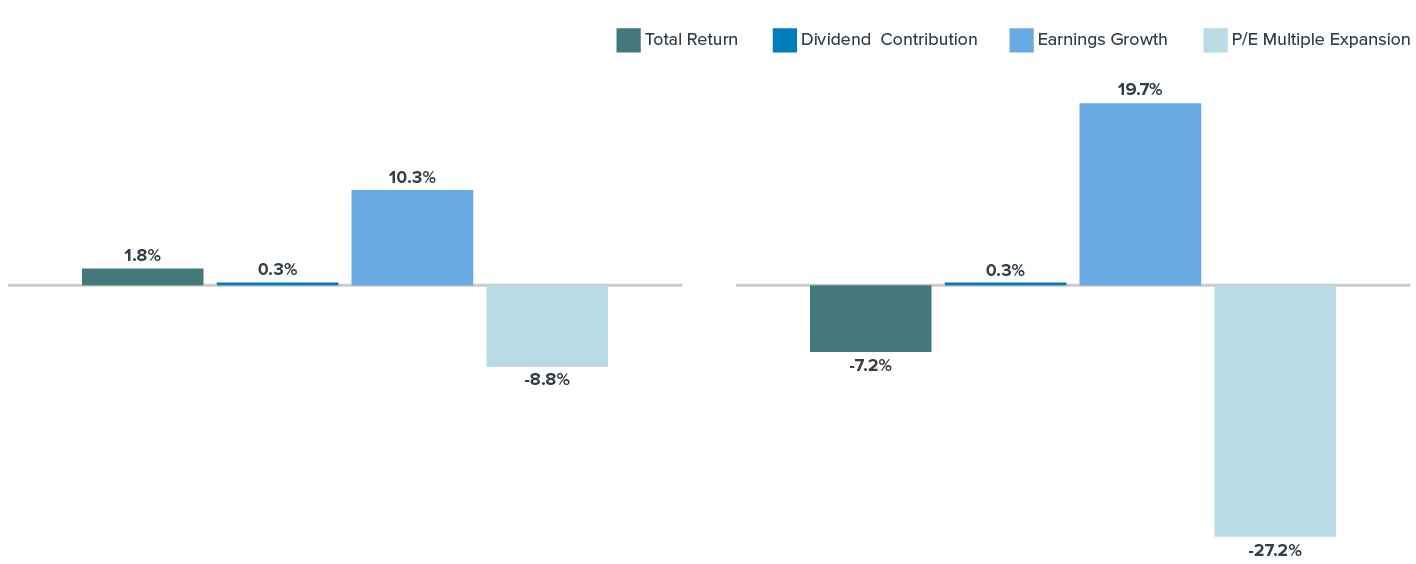
Strong Earnings Growth in the Russell 2000 Was Offset by Multiple Contraction in 3Q26
Despite the Russell 2000’s -7.2% decline in the third quarter, earnings growth made a substantial positive contribution to small-cap returns. Earnings growth contributed 19.7%, compared with 10.3% for the Russell 1000. However, a significant 27.2% negative contribution from P/E multiple contraction more than offset small-caps’ earnings gains. We believe this divergence between earnings fundamentals and valuations underscores the importance of distinguishing business performance from short-term changes in market sentiment.



U.S. Small Cap Market Overview Royce Investment Partners
PAGE 19
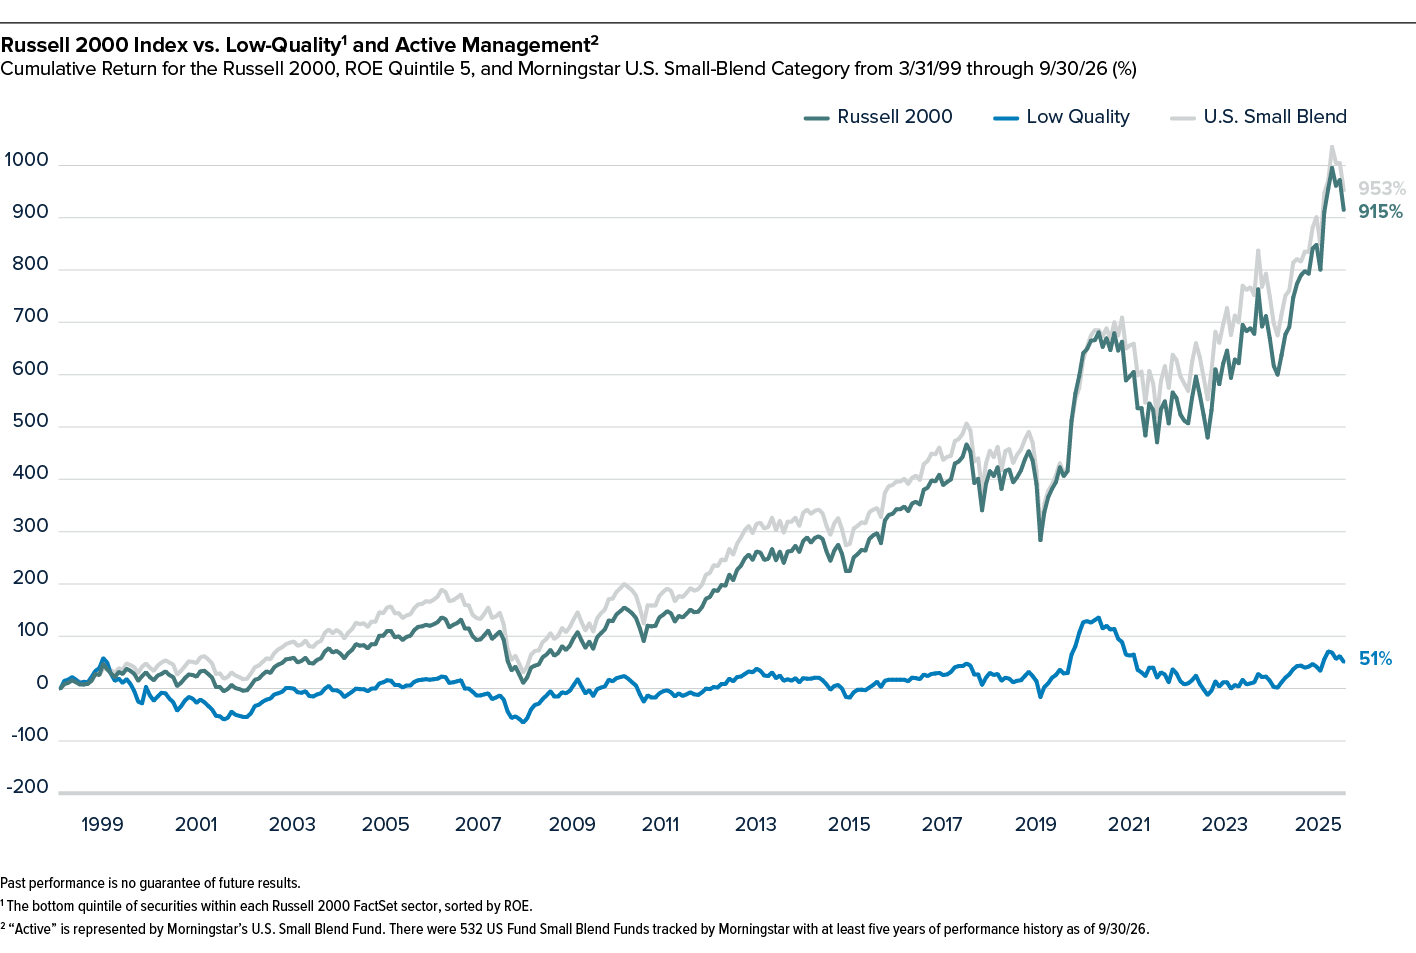
Low Quality Has Underperformed Over the Long Run
U.S. Small Cap Market Overview Royce Investment Partners
PAGE 20
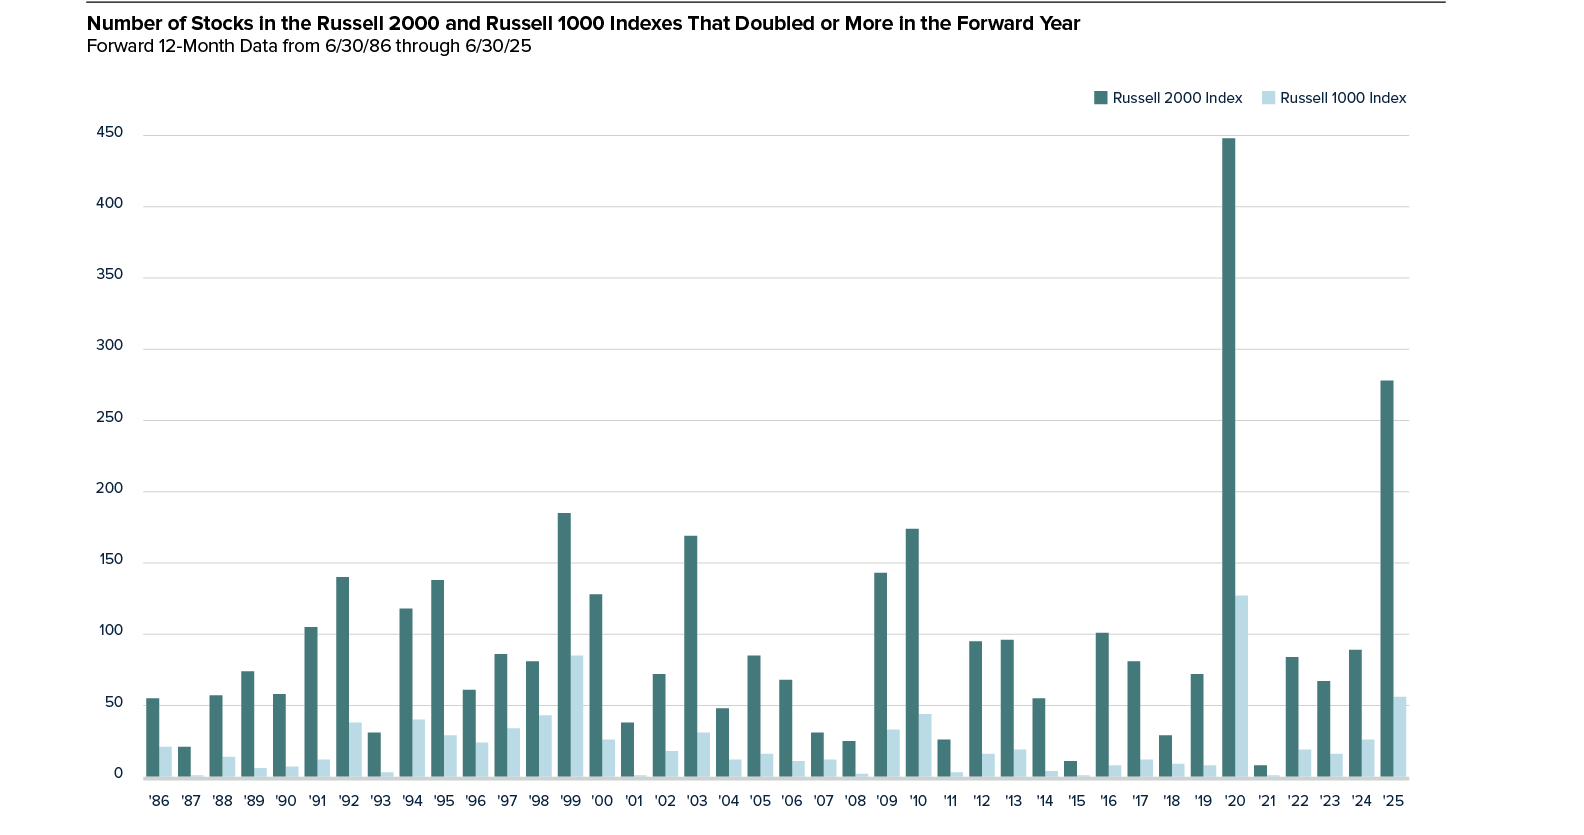
The Most Alpha Generation Potential Remains in Small-Cap
Historically, small-cap equities have offered an opportunity set for active managers because of greater dispersion, less analyst coverage, and a broader universe. As the chart shows, the Russell 2000 has produced many more stocks that doubled (or more) over subsequent 12-month periods than the Russell 1000, underscoring the depth of potential alpha in small-caps. In our view, valuations, improving earnings dynamics, and elevated dispersion create an environment for active, fundamentals-driven small-cap investing.

U.S. Small Cap Market Overview Royce Investment Partners
PAGE 21
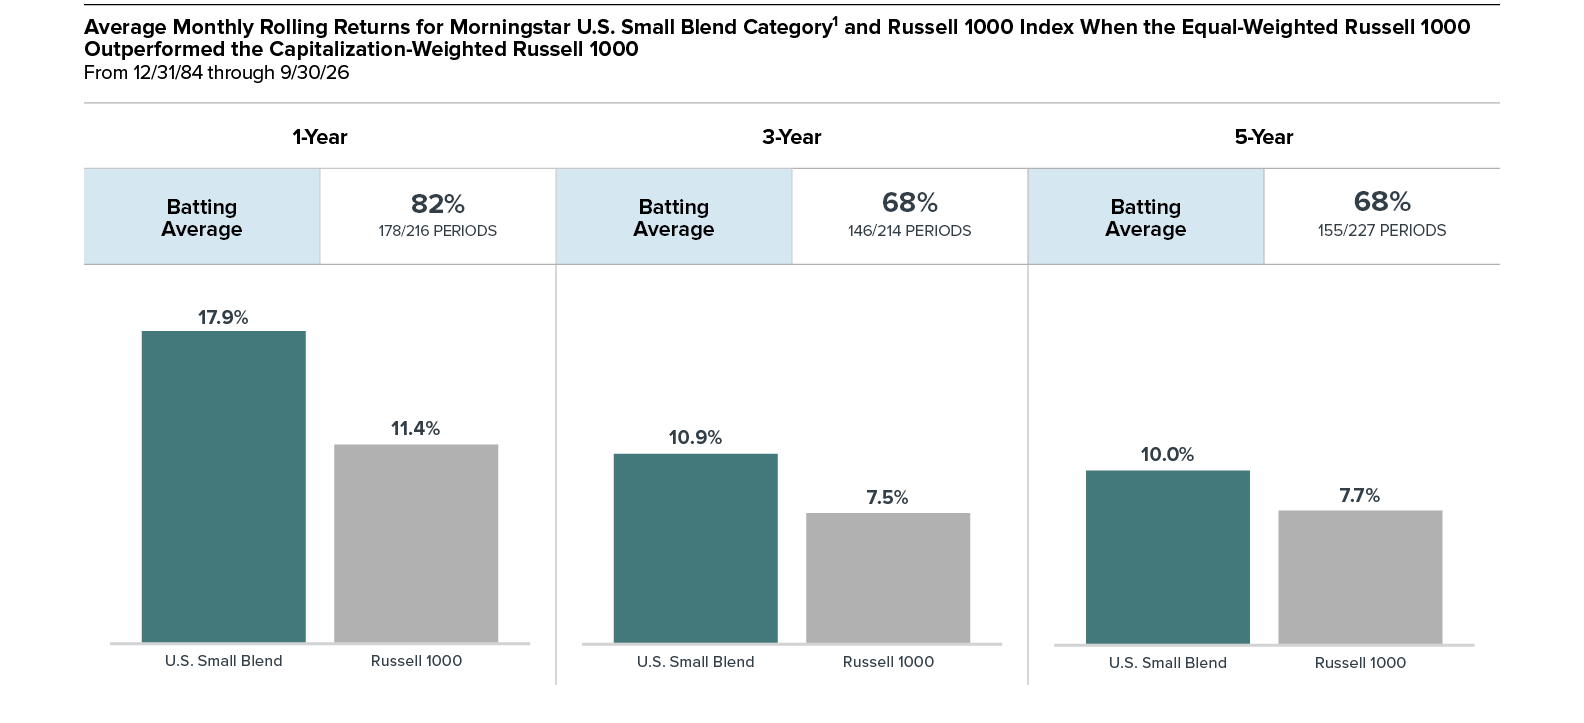
Active Small-Cap Has Historically Outperformed in Broadening Markets
Active small-cap managers have historically outperformed during periods when market leadership broadened beyond the largest stocks. As market participation widens, the larger opportunity set has historically created a more favorable backdrop for active managers to add value.

U.S. Small Cap Market Overview Royce Investment Partners
PAGE 22
Large Intra-Year Declines Are Frequent
Large intra-year declines are common for small-cap stocks, with the Russell 2000 experiencing an average drawdown of about -19.6%, yet calendar-year returns have still averaged a healthy 10.2%. This pattern highlights that short-term volatility has historically not prevented longer-term gains for the asset class.
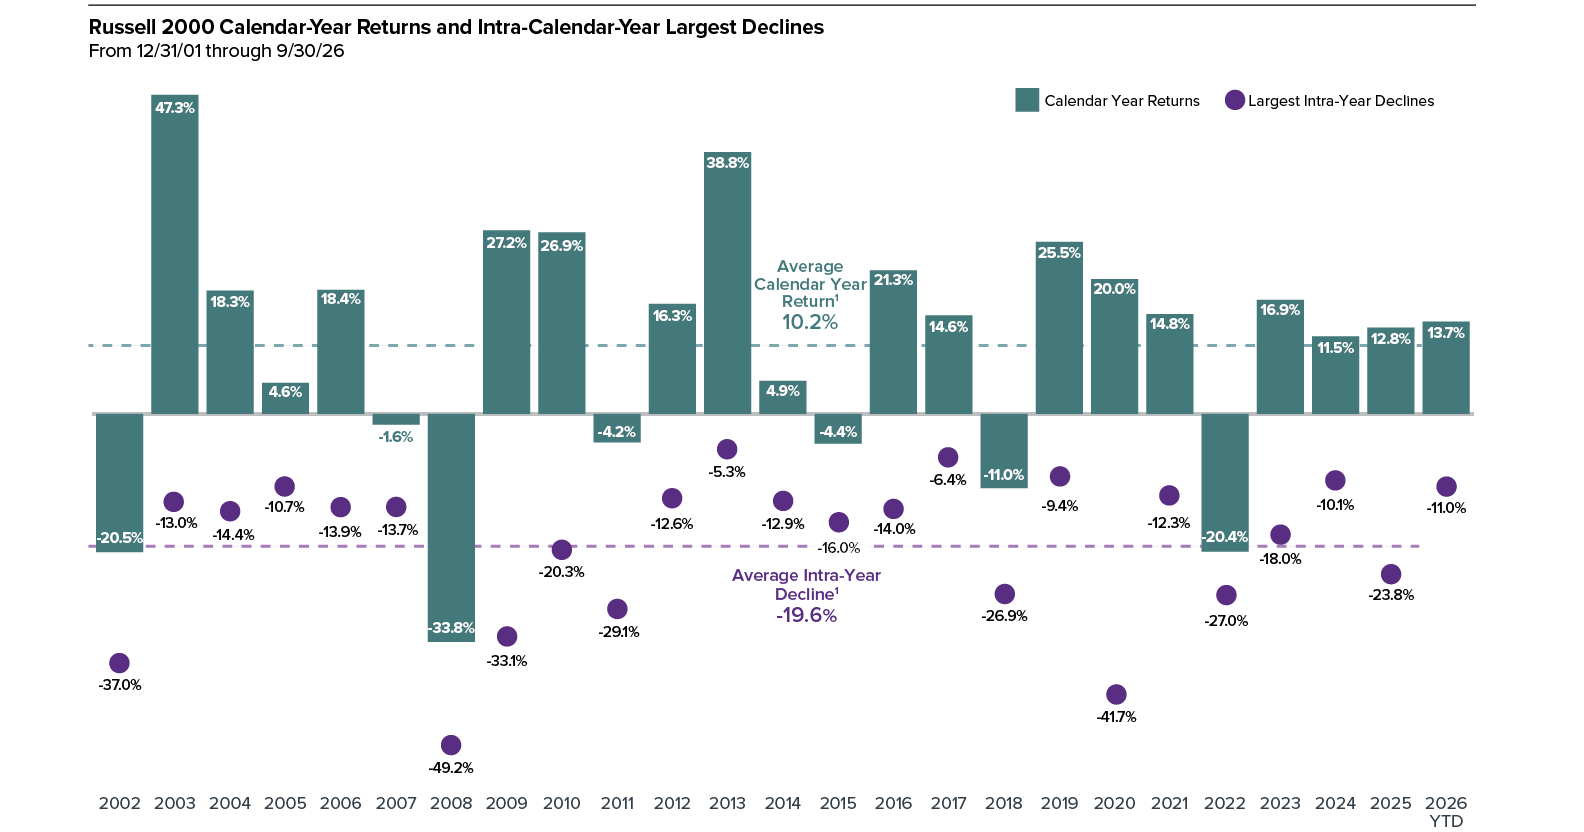
1Year-to-date data is not included in averages. Past performance is no guarantee of future results.
U.S. Small Cap Market Overview Royce Investment Partners
PAGE 23
Key Takeaways for 3Q26
Market Overview
Small- and micro-cap stocks underperformed in the third quarter following a strong second-quarter rally, as large- and mega-cap companies benefited in part from investments in artificial intelligence infrastructure. The Russell 2000 and Russell Microcap Indexes each fell 7.2%, while the Russell 1000 rose 1.8% and the Russell Top 50 gained 4.1%. Despite the reversal, smaller stocks retained a year-to-date lead: the Russell 2000 advanced 13.7% and the Russell Microcap rose 18.3%, compared with gains of 12.3% and 6.2% for the Russell 1000 and Russell Top 50, respectively.
Within small-caps, lower-leverage and dividend-paying stocks demonstrated greater resilience during the quarter, while companies with higher returns on invested capital materially outperformed their less profitable counterparts. These distinctions reinforce our view that balance-sheet strength, durable profitability, and disciplined stock selection remain essential in an environment marked by uneven market leadership and macroeconomic uncertainty.
Historical Perspective
While elevated valuations remain a concern across U.S. equities, particularly among larger-cap stocks, small-caps continue to offer attractive relative valuations. As of September 30, 2026, the Russell 2000 represented just 4.0% of the Russell 3000’s total market capitalization, well below its historical average of 7.6%. Valuation multiples further highlight this disparity. At September 30, 2026, the Russell 2000 traded at a median EV/EBIT multiple of 16.3x, compared with 19.1x for the Russell 1000. Small-cap value stocks appeared especially attractive, trading at 15.0x, below their 25-year historical average of 15.3x.
Looking ahead, we believe these favorable valuations, combined with the potential for improving earnings growth and lower borrowing costs, could support small-cap performance. We see particularly compelling opportunities in high-quality businesses with durable fundamentals, strong balance sheets, and management teams committed to disciplined capital allocation.
U.S. Small Cap Market Overview Royce Investment Partners
PAGE 24
Key Takeaways for 3Q26 (continued)
Small-Cap Market Outlook
Despite third-quarter weakness, we remain optimistic on the long-term outlook for U.S. small-caps. Consensus estimates project Russell 2000 earnings-per-share growth of 40.5% in 2026 and 49.8% in 2027, exceeding expectations for the Russell 1000, although these forecasts partly reflect a lower earnings base and remain subject to revision. The third-quarter selloff was driven more by contracting valuation multiples than deteriorating earnings fundamentals, highlighting a disconnect between business performance and investor sentiment. Higher interest rates and financing costs remain risks, especially for more leveraged companies, but businesses with strong balance sheets may be better positioned to invest, pursue acquisitions, and withstand volatility. Meanwhile, reshoring, infrastructure modernization, automation, and artificial intelligence adoption offer potential growth opportunities across domestically oriented businesses. Recent corrections may also allow disciplined investors to establish positions in fundamentally sound companies at more attractive valuations. We believe dispersion in earnings quality, financial strength, and valuations reinforces the importance of active, research-driven stock selection, particularly when market volatility obscures underlying business fundamentals.
U.S. Small Cap Market Overview Royce Investment Partners
PAGE 25

The performance data and trends outlined in this presentation are presented for illustrative purposes only. All performance information is presented on a total return basis and reflects the reinvestment of distributions. Past performance is no guarantee of future results. Historical market trends are not necessarily indicative of future market movements. The Russell 2000 Index is an unmanaged, capitalization-weighted index of domestic small-cap stocks. It measures the performance of the 2,000 smallest publicly traded U.S. companies in the Russell 3000 Index. The Russell 2000 Value and Growth indexes consist of the respective value and growth stocks within the Russell 2000 as determined by Russell Investments. The Russell 1000 index is an unmanaged, capitalization-weighted index of domestic large-cap stocks. It measures the performance of the 1,000 largest publicly traded U.S. companies in the Russell 3000 index. The Russell Top 50 Mega Cap Index is an unmanaged, capitalization-weighted index of domestic mega-cap stocks that measures the performance of the 50 largest publicly traded U.S. companies in the Russell 3000 index. The Russell Midcap Index measures the performance of the mid-cap segment of the U.S. equity universe. It includes approximately 800 of the smallest securities in the Russell 1000 Index. The Russell Midcap Value and Growth Indexes consist of the respective value and growth stocks within the Russell Midcap as determined by Russell Investments. The Russell 1000 index is an unmanaged, capitalization-weighted index of domestic large-cap stocks. It measures the performance of the 1,000 largest publicly traded U.S. companies in the Russell 3000 index. The Russell 1000 Value and Growth indexes consist of the respective value and growth stocks within the Russell 1000 as determined by Russell Investments. The Bloomberg Barclays US Aggregate Bond Index is an unmanaged, capitalization-weighted index of investment grade, US dollar-denominated, fixed-rate taxable bonds. Frank Russell Company (“Russell”) is the source and owner of the trademarks, service marks and copyrights related to the Russell Indexes. Russell® is a trademark of Frank Russell Company. Neither Russell nor its licensors accept any liability for any errors or omissions in the Russell Indexes and / or Russell ratings or underlying data and no party may rely on any Russell Indexes and / or Russell ratings and / or underlying data contained in this communication. No further distribution of Russell Data is permitted without Russell’s express written consent. Russell does not promote, sponsor or endorse the content of this communication. The S&P 500 is an index of U.S. large-cap stocks selected by Standard & Poor’s based on market size, liquidity, and industry grouping, among other factors, and includes reinvested dividends. The CRSP (Center for Research in Security Pricing) equally divides the companies listed on the NYSE into 10 deciles based on market capitalization. Deciles 1-5 represent the largest domestic equity companies and Deciles 6-10 represent the smallest. CRSP then sorts all listed domestic equity companies based on these market cap ranges. By way of comparison, the CRSP 1-5 would have similar capitalization parameters to the S&P 500 and the CRSP 6-10 would have similar capitalization parameters to those of the Russell 2000. Index returns include net reinvested dividends and/or interest income. The performance of an index does not represent exactly any particular investment, as you cannot invest directly in an index. Royce & Associates, LP, the investment advisor of The Royce Fund and Royce Capital Fund, is a limited partnership organized under the laws of Delaware. Royce & Associates, LP primarily conducts its business under the name Royce Investment Partners.
Sector and industry weightings are determined using the Global Industry Classification Standard (“GICS”). GICS was developed by, and is the exclusive property of, Standard & Poor’s Financial Services LLC (“S&P”) and MSCI Inc. (“MSCI”). GICS is the trademark of S&P and MSCI. “Global Industry Classification Standard (GICS)” and “GICS Direct” are service marks of S&P and MSCI.

Notes, Performance, and Risk Disclosure

One Madison Avenue | New York, NY 10010 | P (800) 348-1414 | www.royceinvest.com
Client Services Group | P (800) 33-ROYCE (800-337-6923)